Cost Management
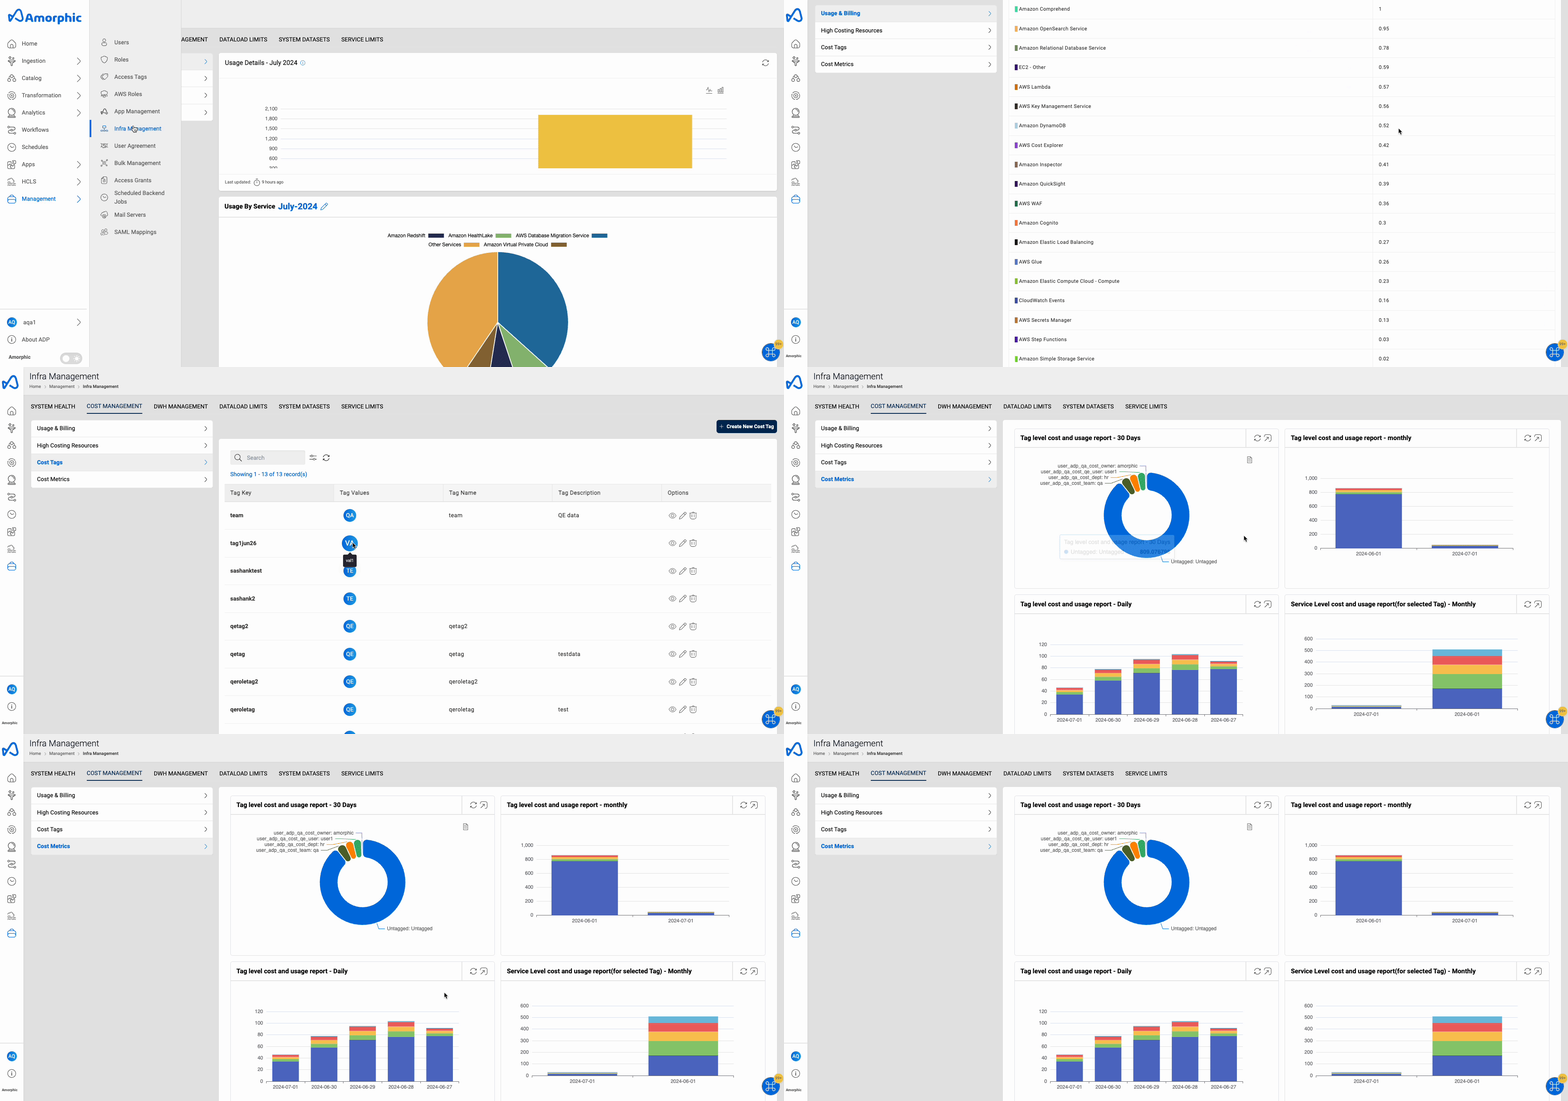
Amorphic Cost Management allows you to keep track of the costs associated with the usage of AWS services and the Amorphic platform over a period of a month. This feature provides you with an overview of the costs you incur and also gives you the ability to drill down and see the cost incurred for each individual service.
The "Usage by Service" section allows you to examine the cost breakdown per service and permits you to choose the specific service for which you wish to view the cost details. This feature helps you in monitoring your expenditure and helps in optimizing your usage of the services. You will also get alerts about resources every twelve hours to clean up or terminate desired resources for cost saving purposes.
You can view four type of costings:
Usage & Billings- Costs you incur over a month for AWS services and Amorphic platform.High Costing Resources- Shows active high costing resources in the application.Cost Tags- Helps administrator to create the Cost Allocation Tags and assign to users.Cost Metrics- Helps users to analyse expenditure with pie and bar charts.
Amorphic Cost explorer lists the following high costing service resources along with their approximate estimated cost:
| Resource | Description |
|---|---|
| Endpoints | Lists all the currently running or active glue development endpoints. |
| Notebooks | Lists all the currently running Machine learning notebooks. |
| Jobs | Lists all the long running ETL jobs which are running for more than 2 hours. |
| Workflows | Lists all the long running workflows which are running for more than 2 hours. |
| Deep Search Indices | Lists all active deep search indices. |
| Interactive Sessions | Lists all currently running or active interactive sessions. |
| Streams | Lists all the currently active Streams. |
| Connection Instances | Lists all the currently active shared/non-shared DMS instances under Amorphic Connection. |
| Omics Stores | Lists all the currently active Omics Stores. |
| Omics Workflows | Lists all the currently running Omics Workflows. |
| Health Lake Stores | Lists all the currently active Health Lake Stores. |
As the name suggests, Cost Explorer displays an approximate EstimatedCost of a resource (Eg. Streams, Endpoints, etc.), hence, the cost calculation will vary if any of the resource is modified(updated) by user.
Whenever a resource gets modified by user, cost will be re-estimated based on the newly updated configuration(Eg. InstanceClass, AllocatedStorage, etc.) of a resource. Hence we try to show an EstimatedCost based on most recent configuration of a resource.
Cost Tags
- Admins can create tags.
- Admins can grant permissions to users to utilize these tags.
- Users can attach tags to amorphic resources that they have created or will create.
- Tags help in tracking the costs attributed to the respective resources.Note
These tags should be activated in MASTER AWS account as Cost Allocation Tags.
Only then AWS starts tracking cost for that particular tag. - After creating tags, users can also attach the supported resources on the same page.
- SCP should be updated in the master aws account to allow the creation of BCM Data Exports
Cost Metrics
We have defined the following 5 KPIs:
Tag Level Cost and Usage Report - 30 Days
- Displays the last 30 days of data on a tag level.
- Visualization: Pie chart.
Tag Level Cost and Usage Report - Monthly
- Displays monthly data (e.g., Jan, Feb, Mar, etc.) for a maximum of 6 months.
- Visualization: Stacked bar chart.
Tag Level Cost and Usage Report - Daily
- Displays daily data for the last 14 days.
- Visualization: Stacked bar chart.
Service Level Cost and Usage Report (for selected Tag) - Monthly
- Displays monthly data for the last 6 months for a specific tag.
- Visualization: Stacked bar chart.
Resource Level Cost and Usage Report (for selected Tag) - Daily
- Displays daily data for the last 7 days upon selection of a tag.
- Visualization: Stacked bar chart.
Additional Details
- 4th and 5th KPIs: These reports are tag-specific, meaning that upon selecting a tag, the related services and resources will be displayed.
- Filtering: For stacked bar charts, users can filter data by selecting specific tags. The data for the selected tags will be displayed accordingly.

Cost Management Restrictions
- Tagging Constraints: Only underscores (
_) are allowed as special characters in tags' keys and values. - Data Export Limit: Each account can create up to 5 data exports. Ensure at least 2 data export slots are available before deploying this feature.
- FIPS Incompatibility: BCM Data Exports are not supported by FIPS.
- Tag-Specific Configuration: User-specific tagging is not supported; configurations must be based on tags.
- Editing Advisory: To maintain configuration integrity, it is advised not to edit data exports once they are created.